Data
Live streams, daily reports, surveys, BHAs, mud data, and historical records.
Drilling intelligence platform
DrillingMetrics links live streams, daily reports, surveys, BHAs, engineering models, and offset history in one operational view. Field and office teams work from the same evidence.
One connected workflow
Each KPI, event, and model result retains the time, depth, wellbore, run, rig state, units, quality, and provenance needed to interpret it.
Live streams, daily reports, surveys, BHAs, mud data, and historical records.
Time, depth, wellbore, run, rig state, units, quality, and provenance.
KPIs, torque and drag, hydraulics, dysfunction beliefs, and comparisons.
Operational views, alerts, reports, and explanations that teams can verify.
Platform
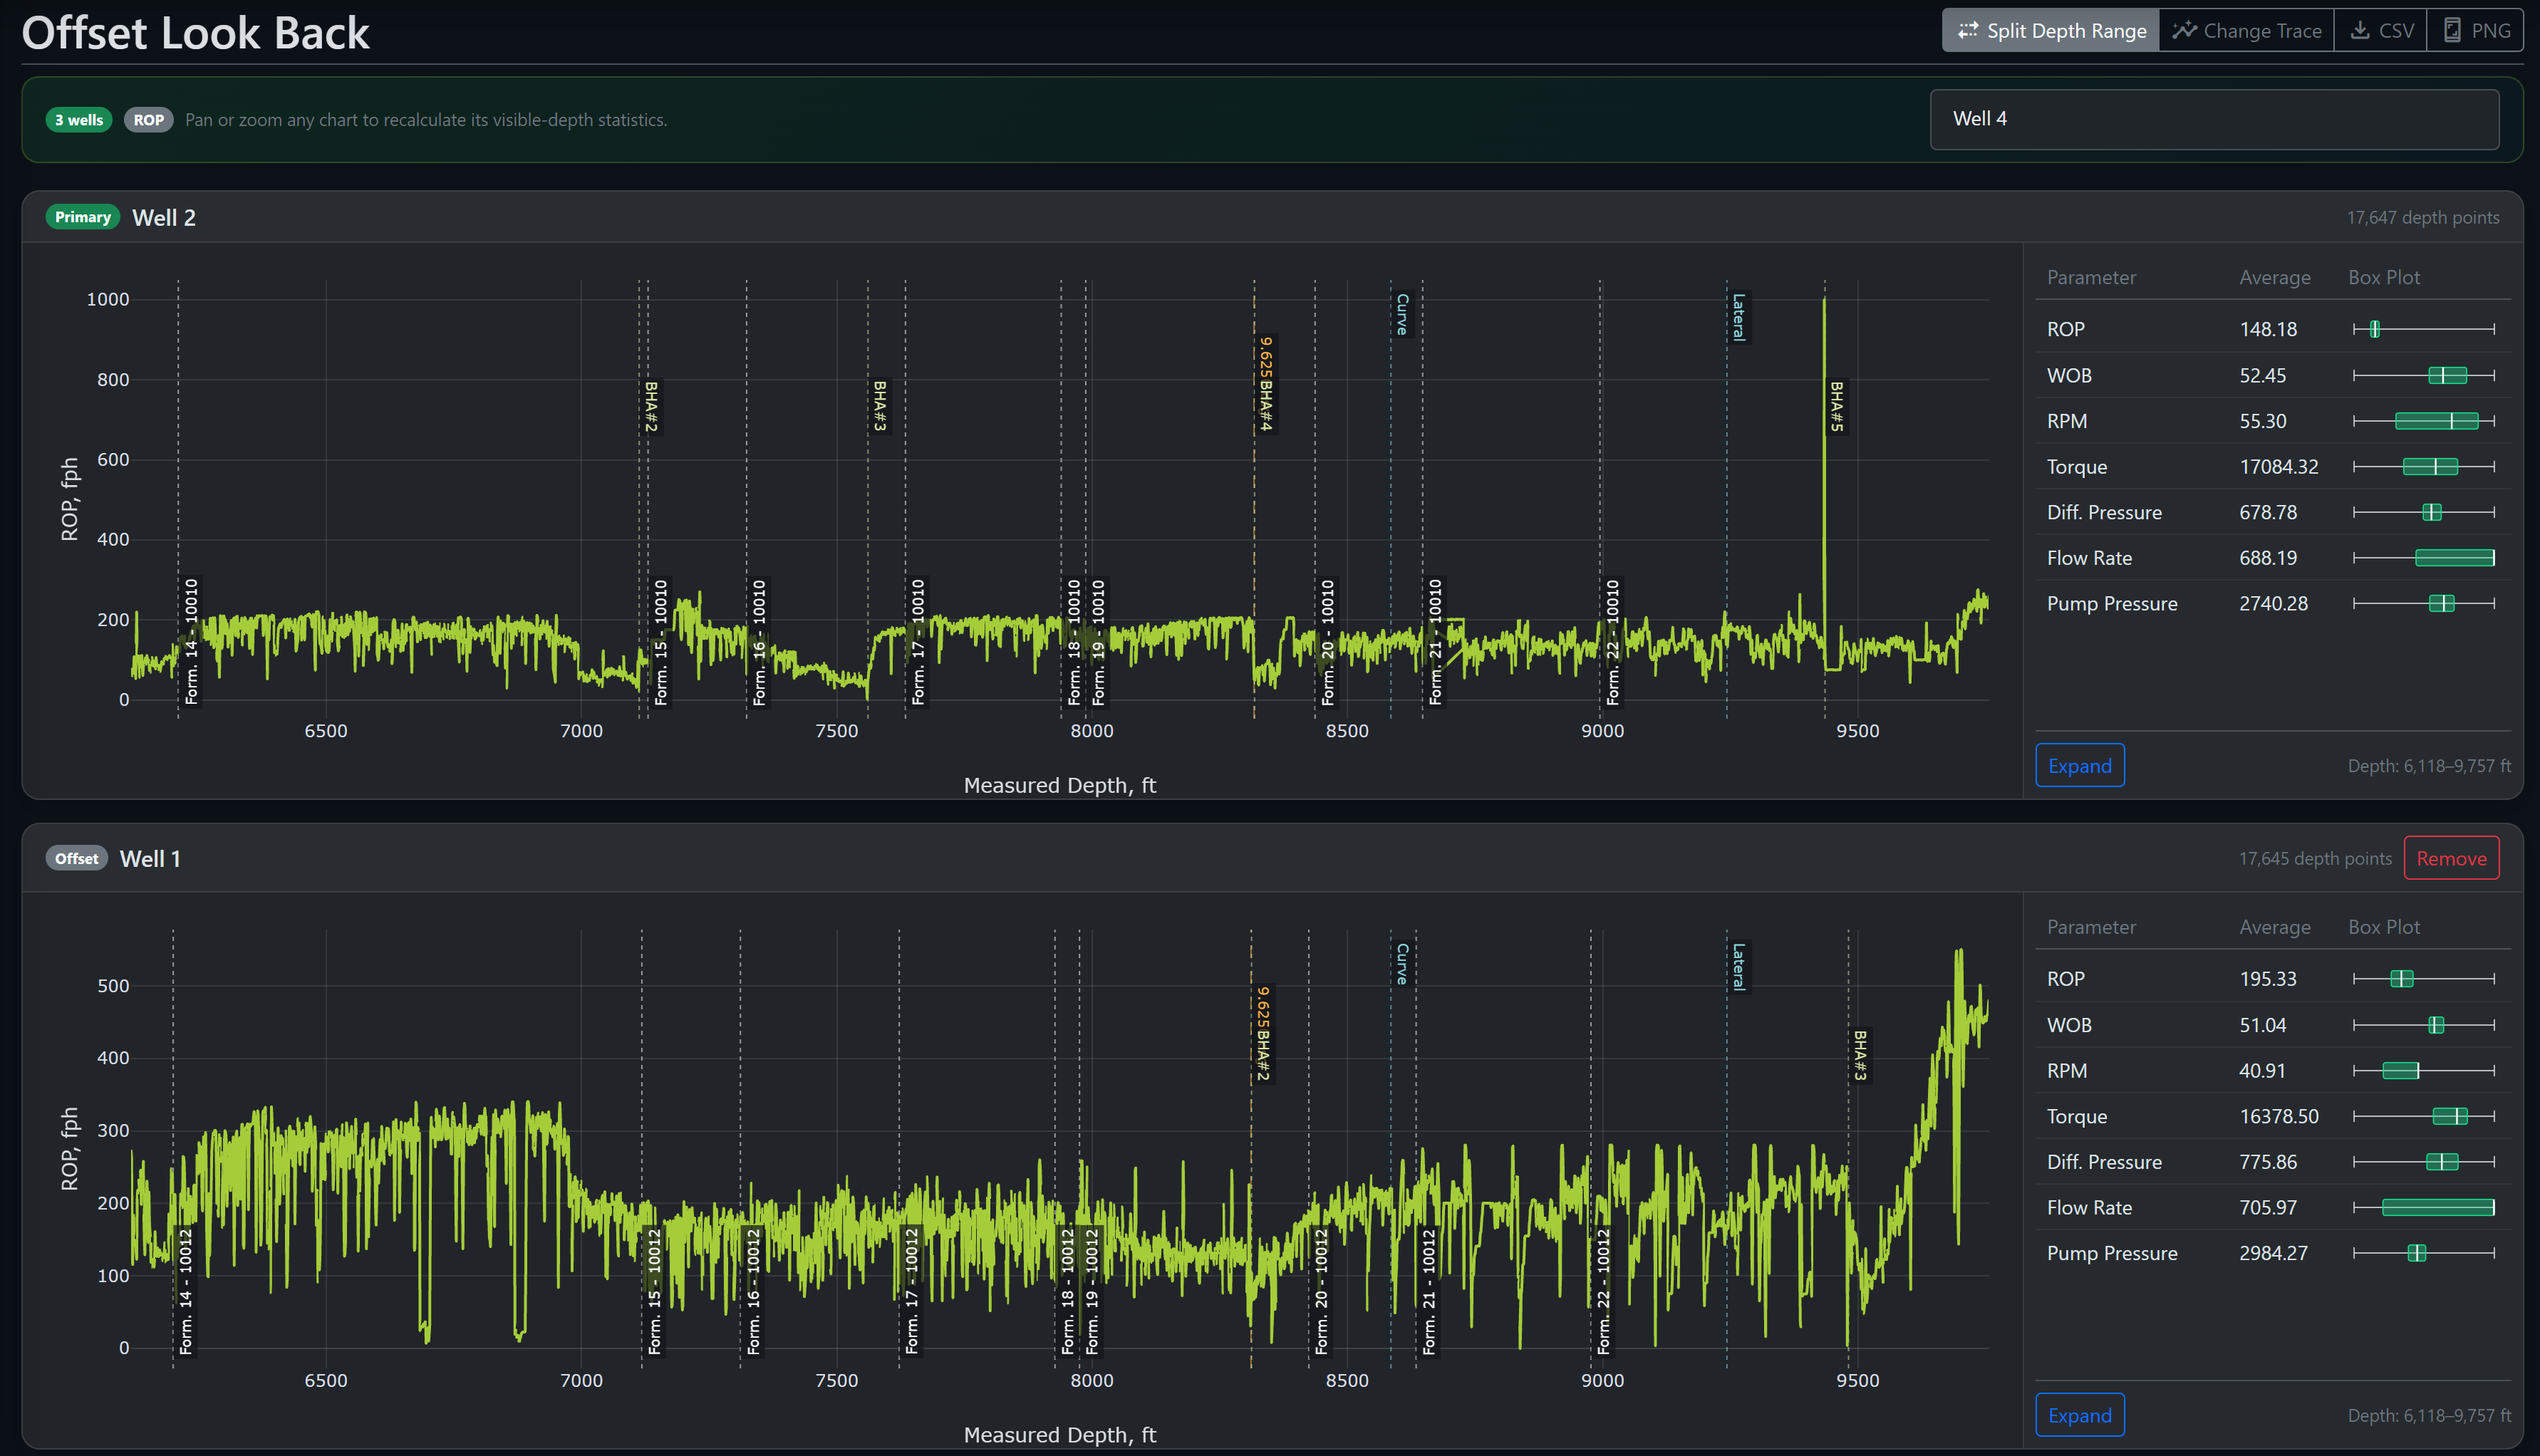
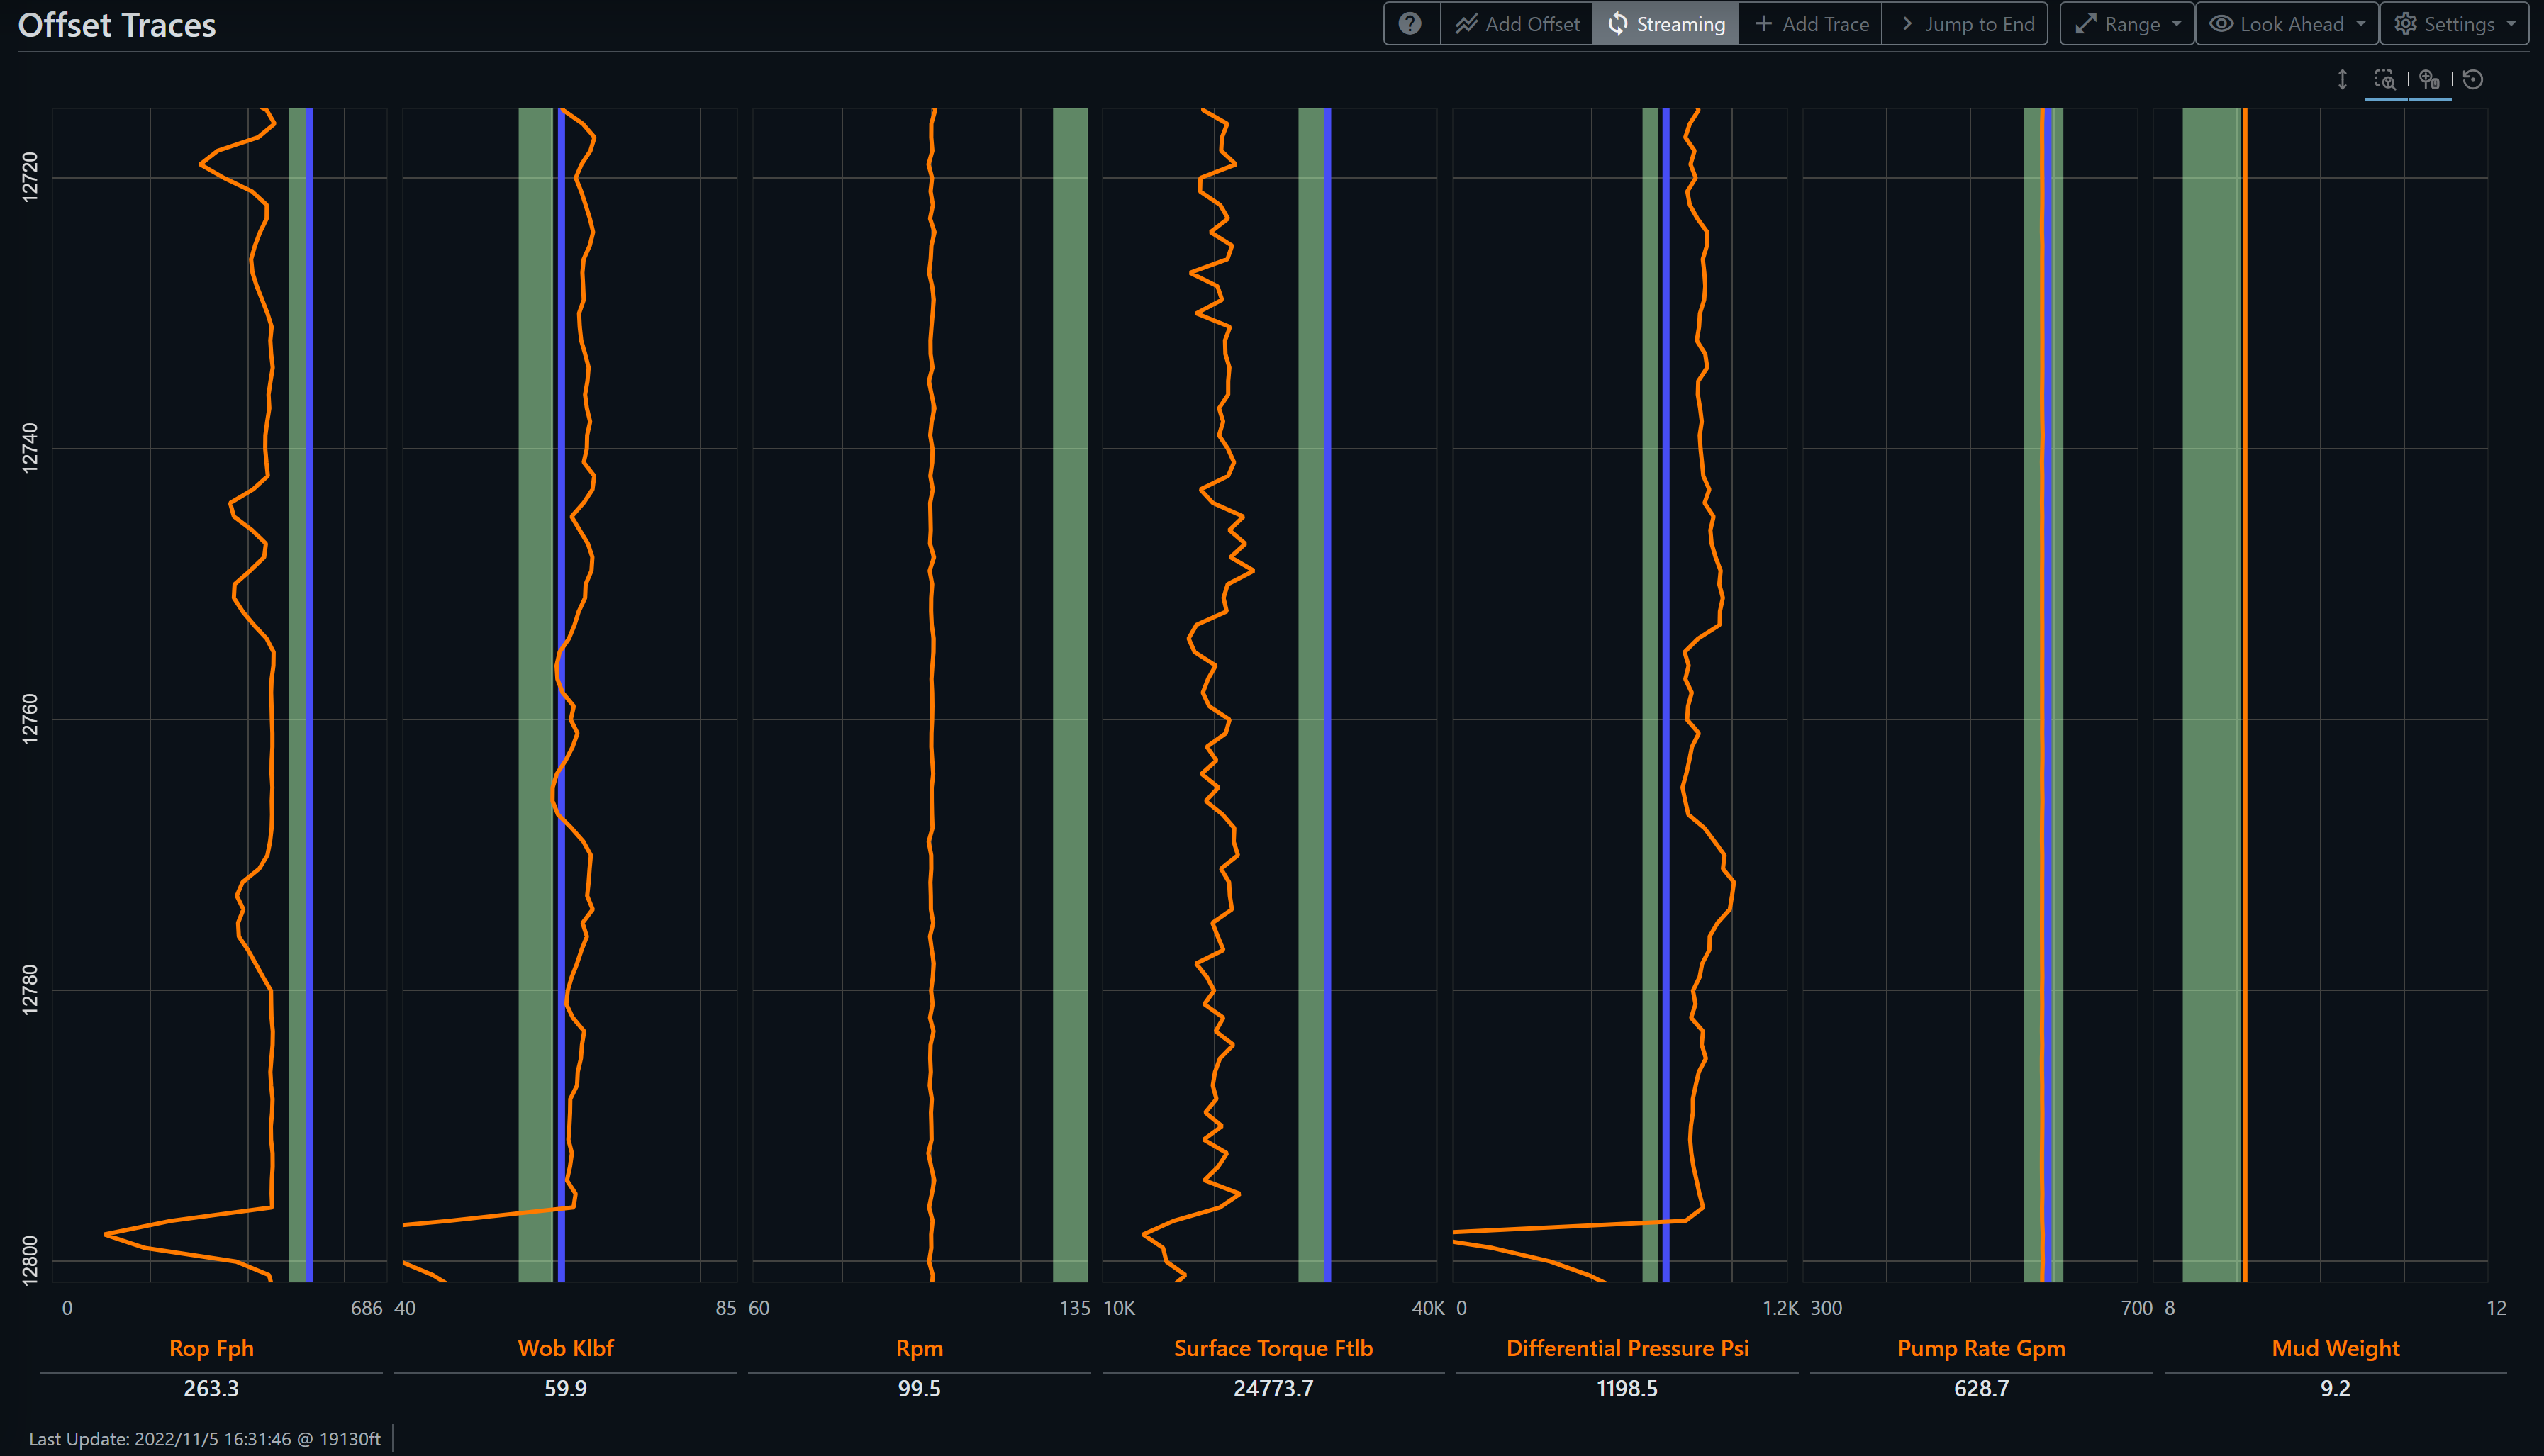
Performance and offsets
Align relevant footage by depth, exclude off-bottom states, and keep section, run, BHA, and formation context with the result.
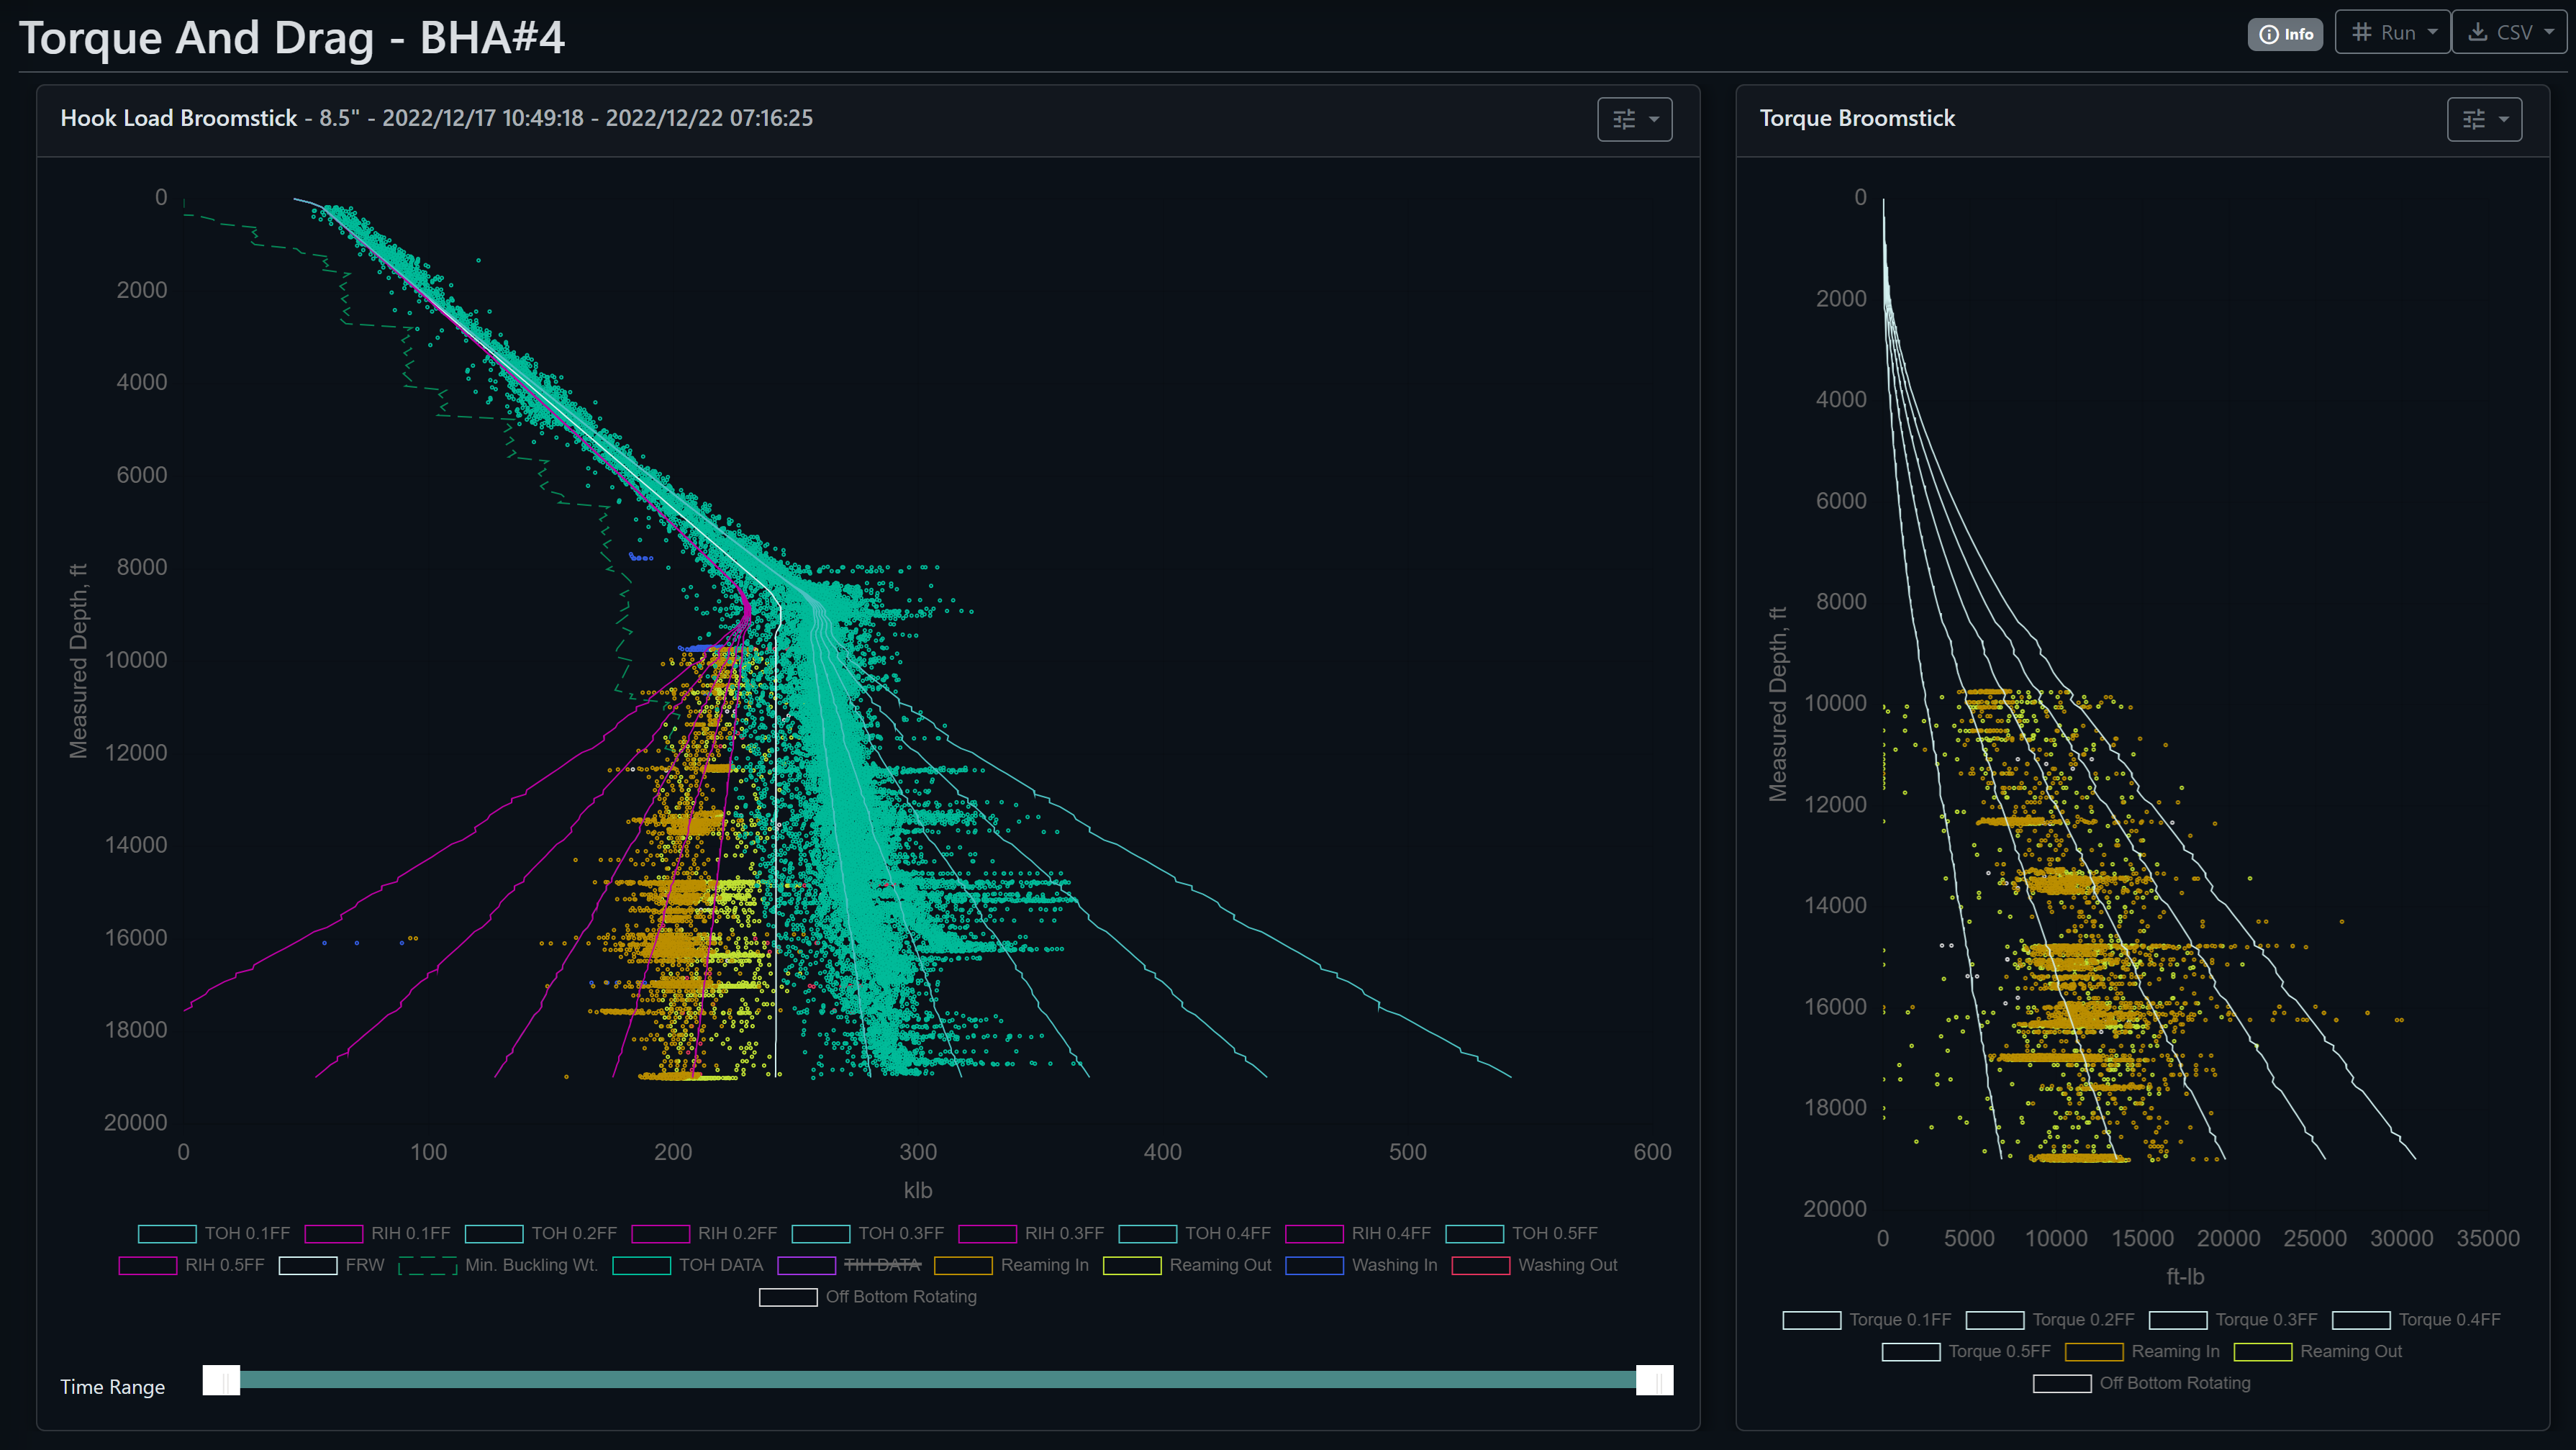
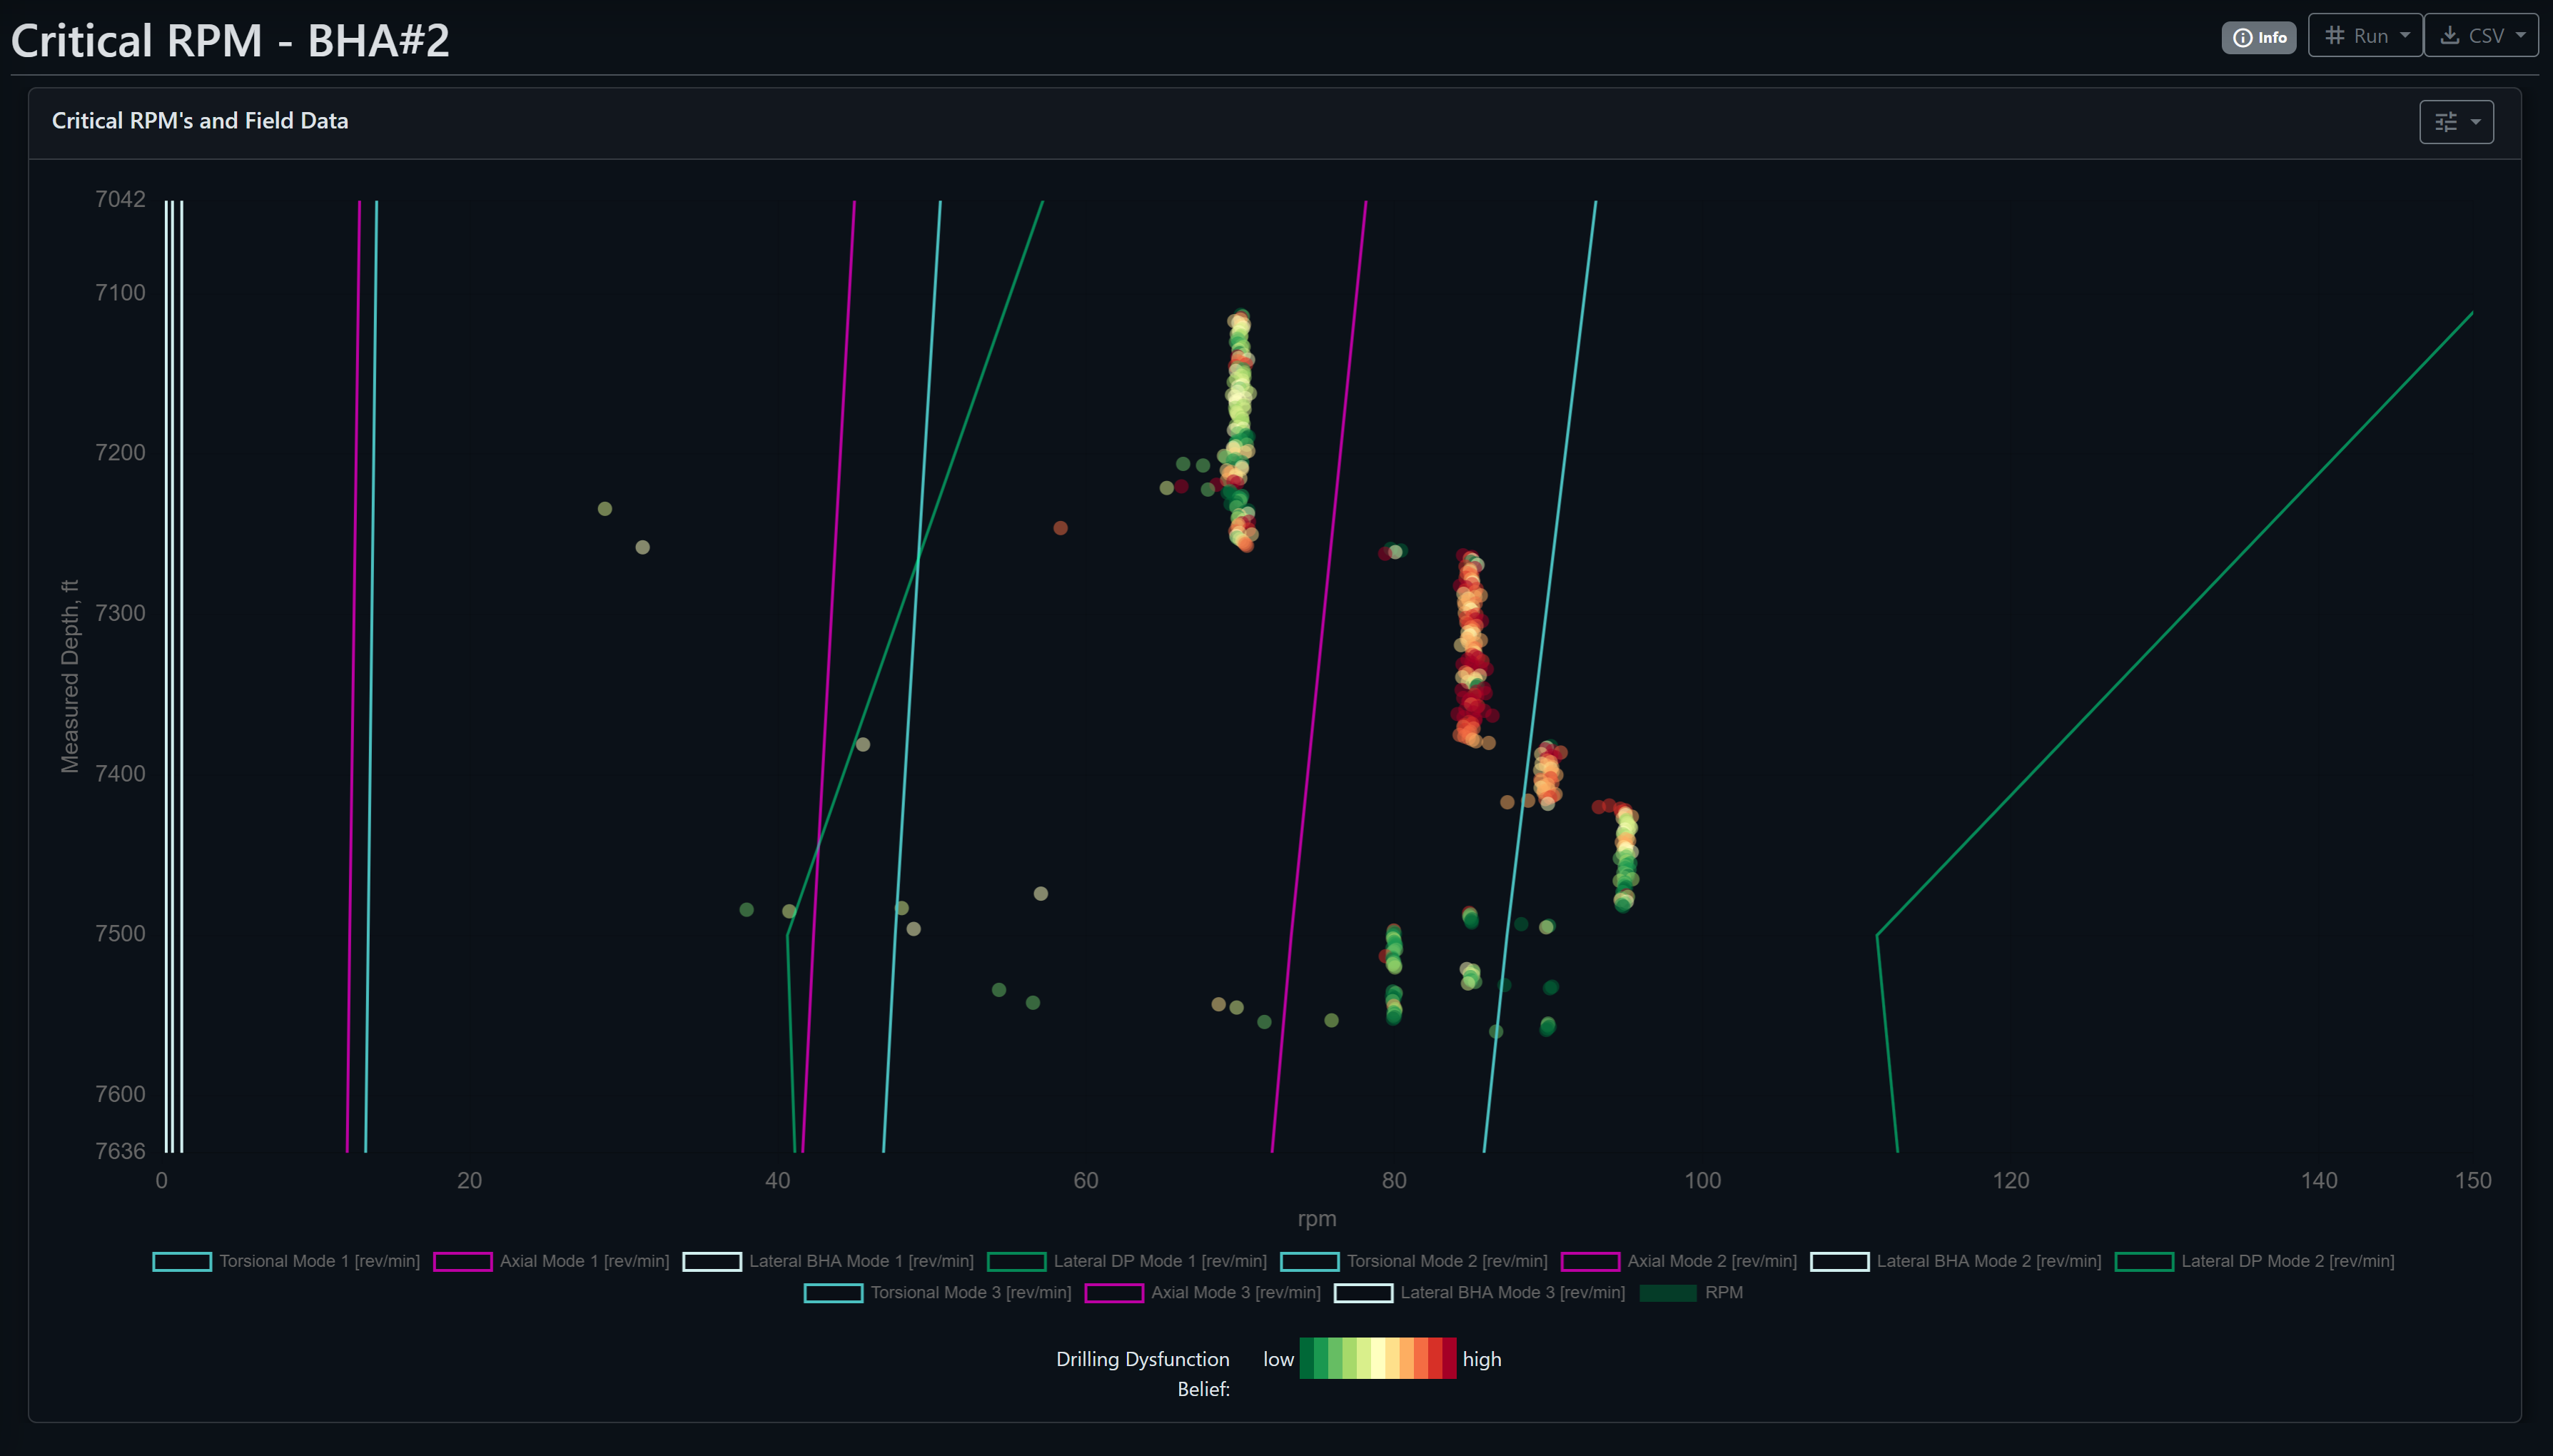
Engineering models
Compare pickup, slack-off, torque, and field RPM with depth-aligned torque-and-drag and BHA critical-speed models. Inputs, units, and assumptions remain visible.
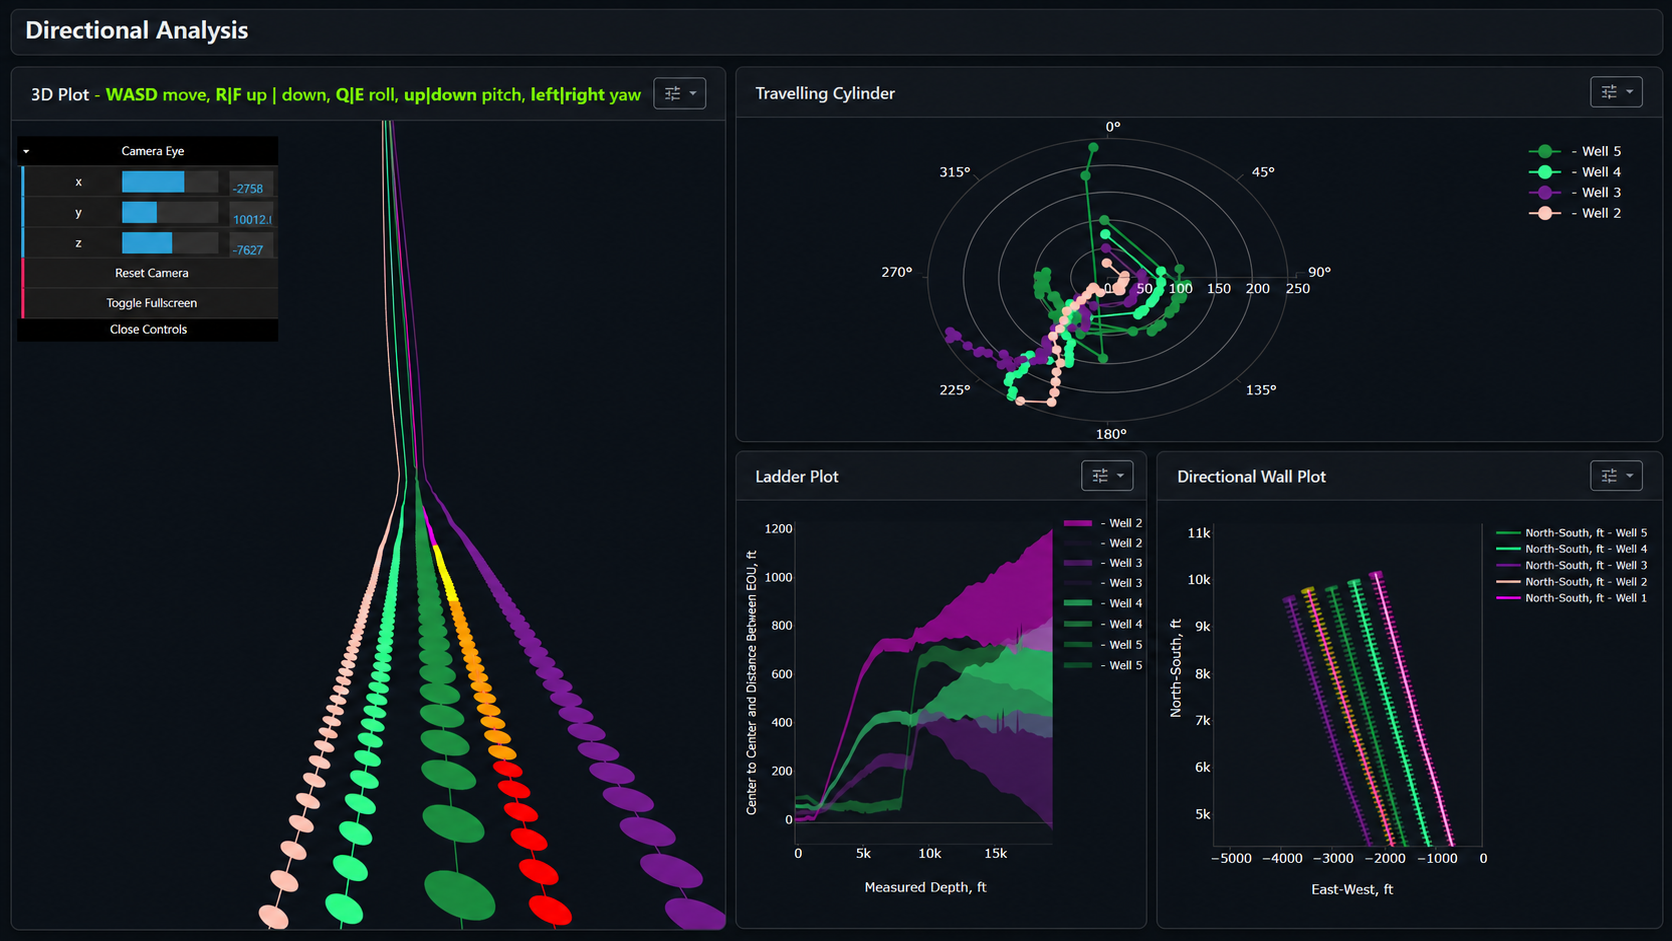
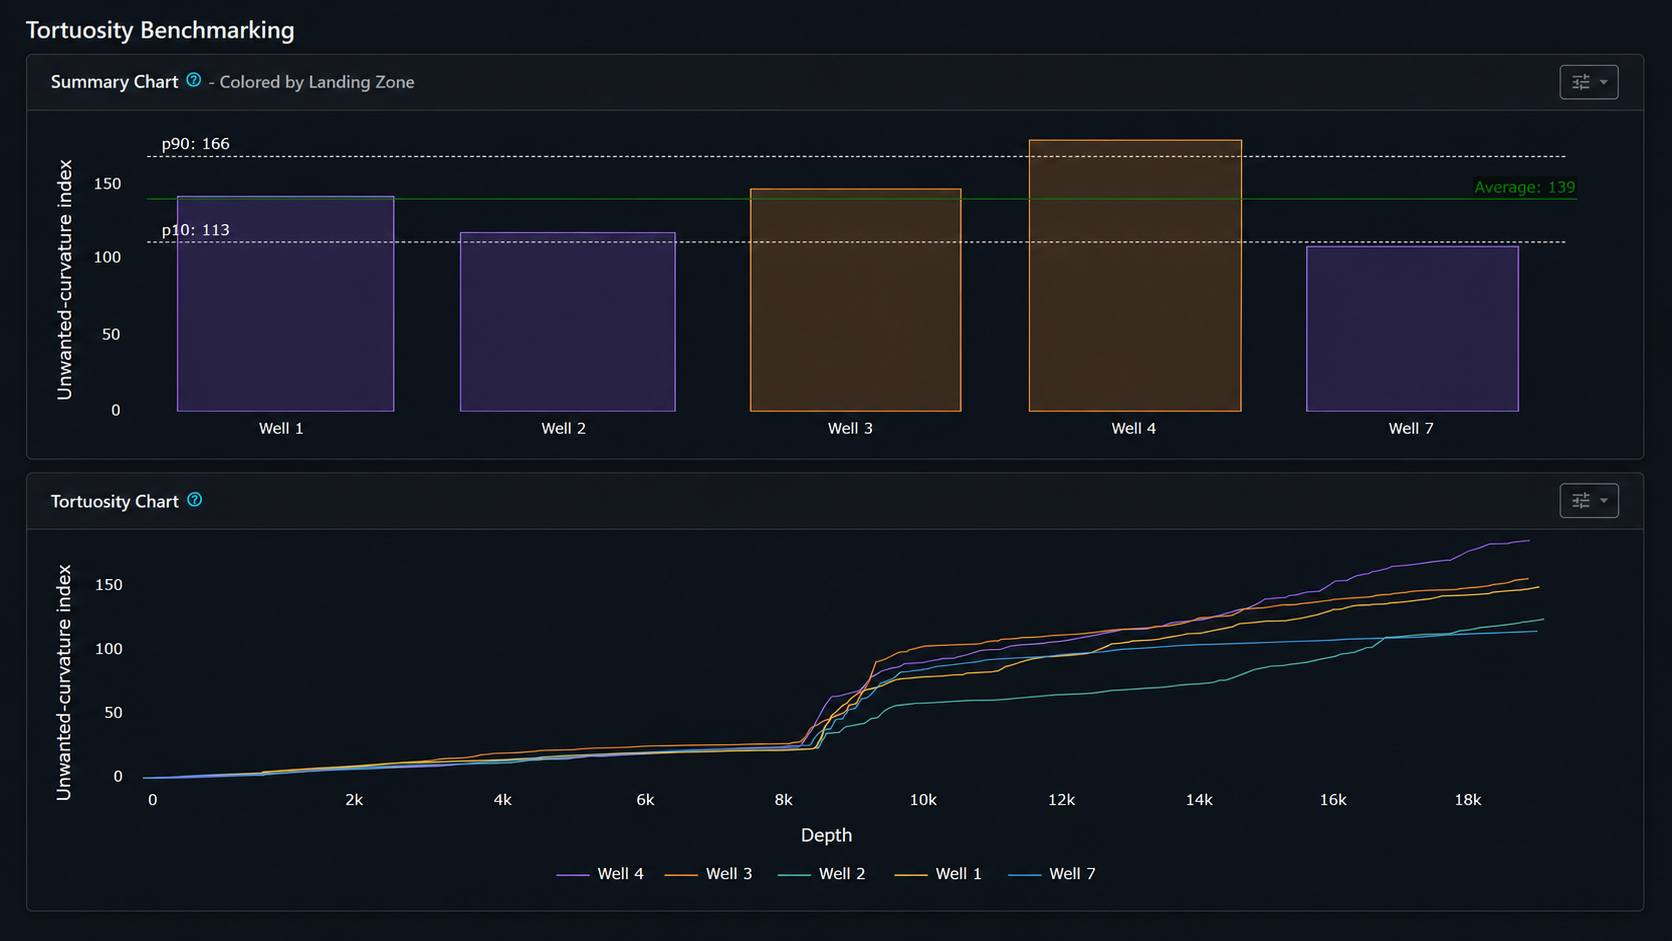
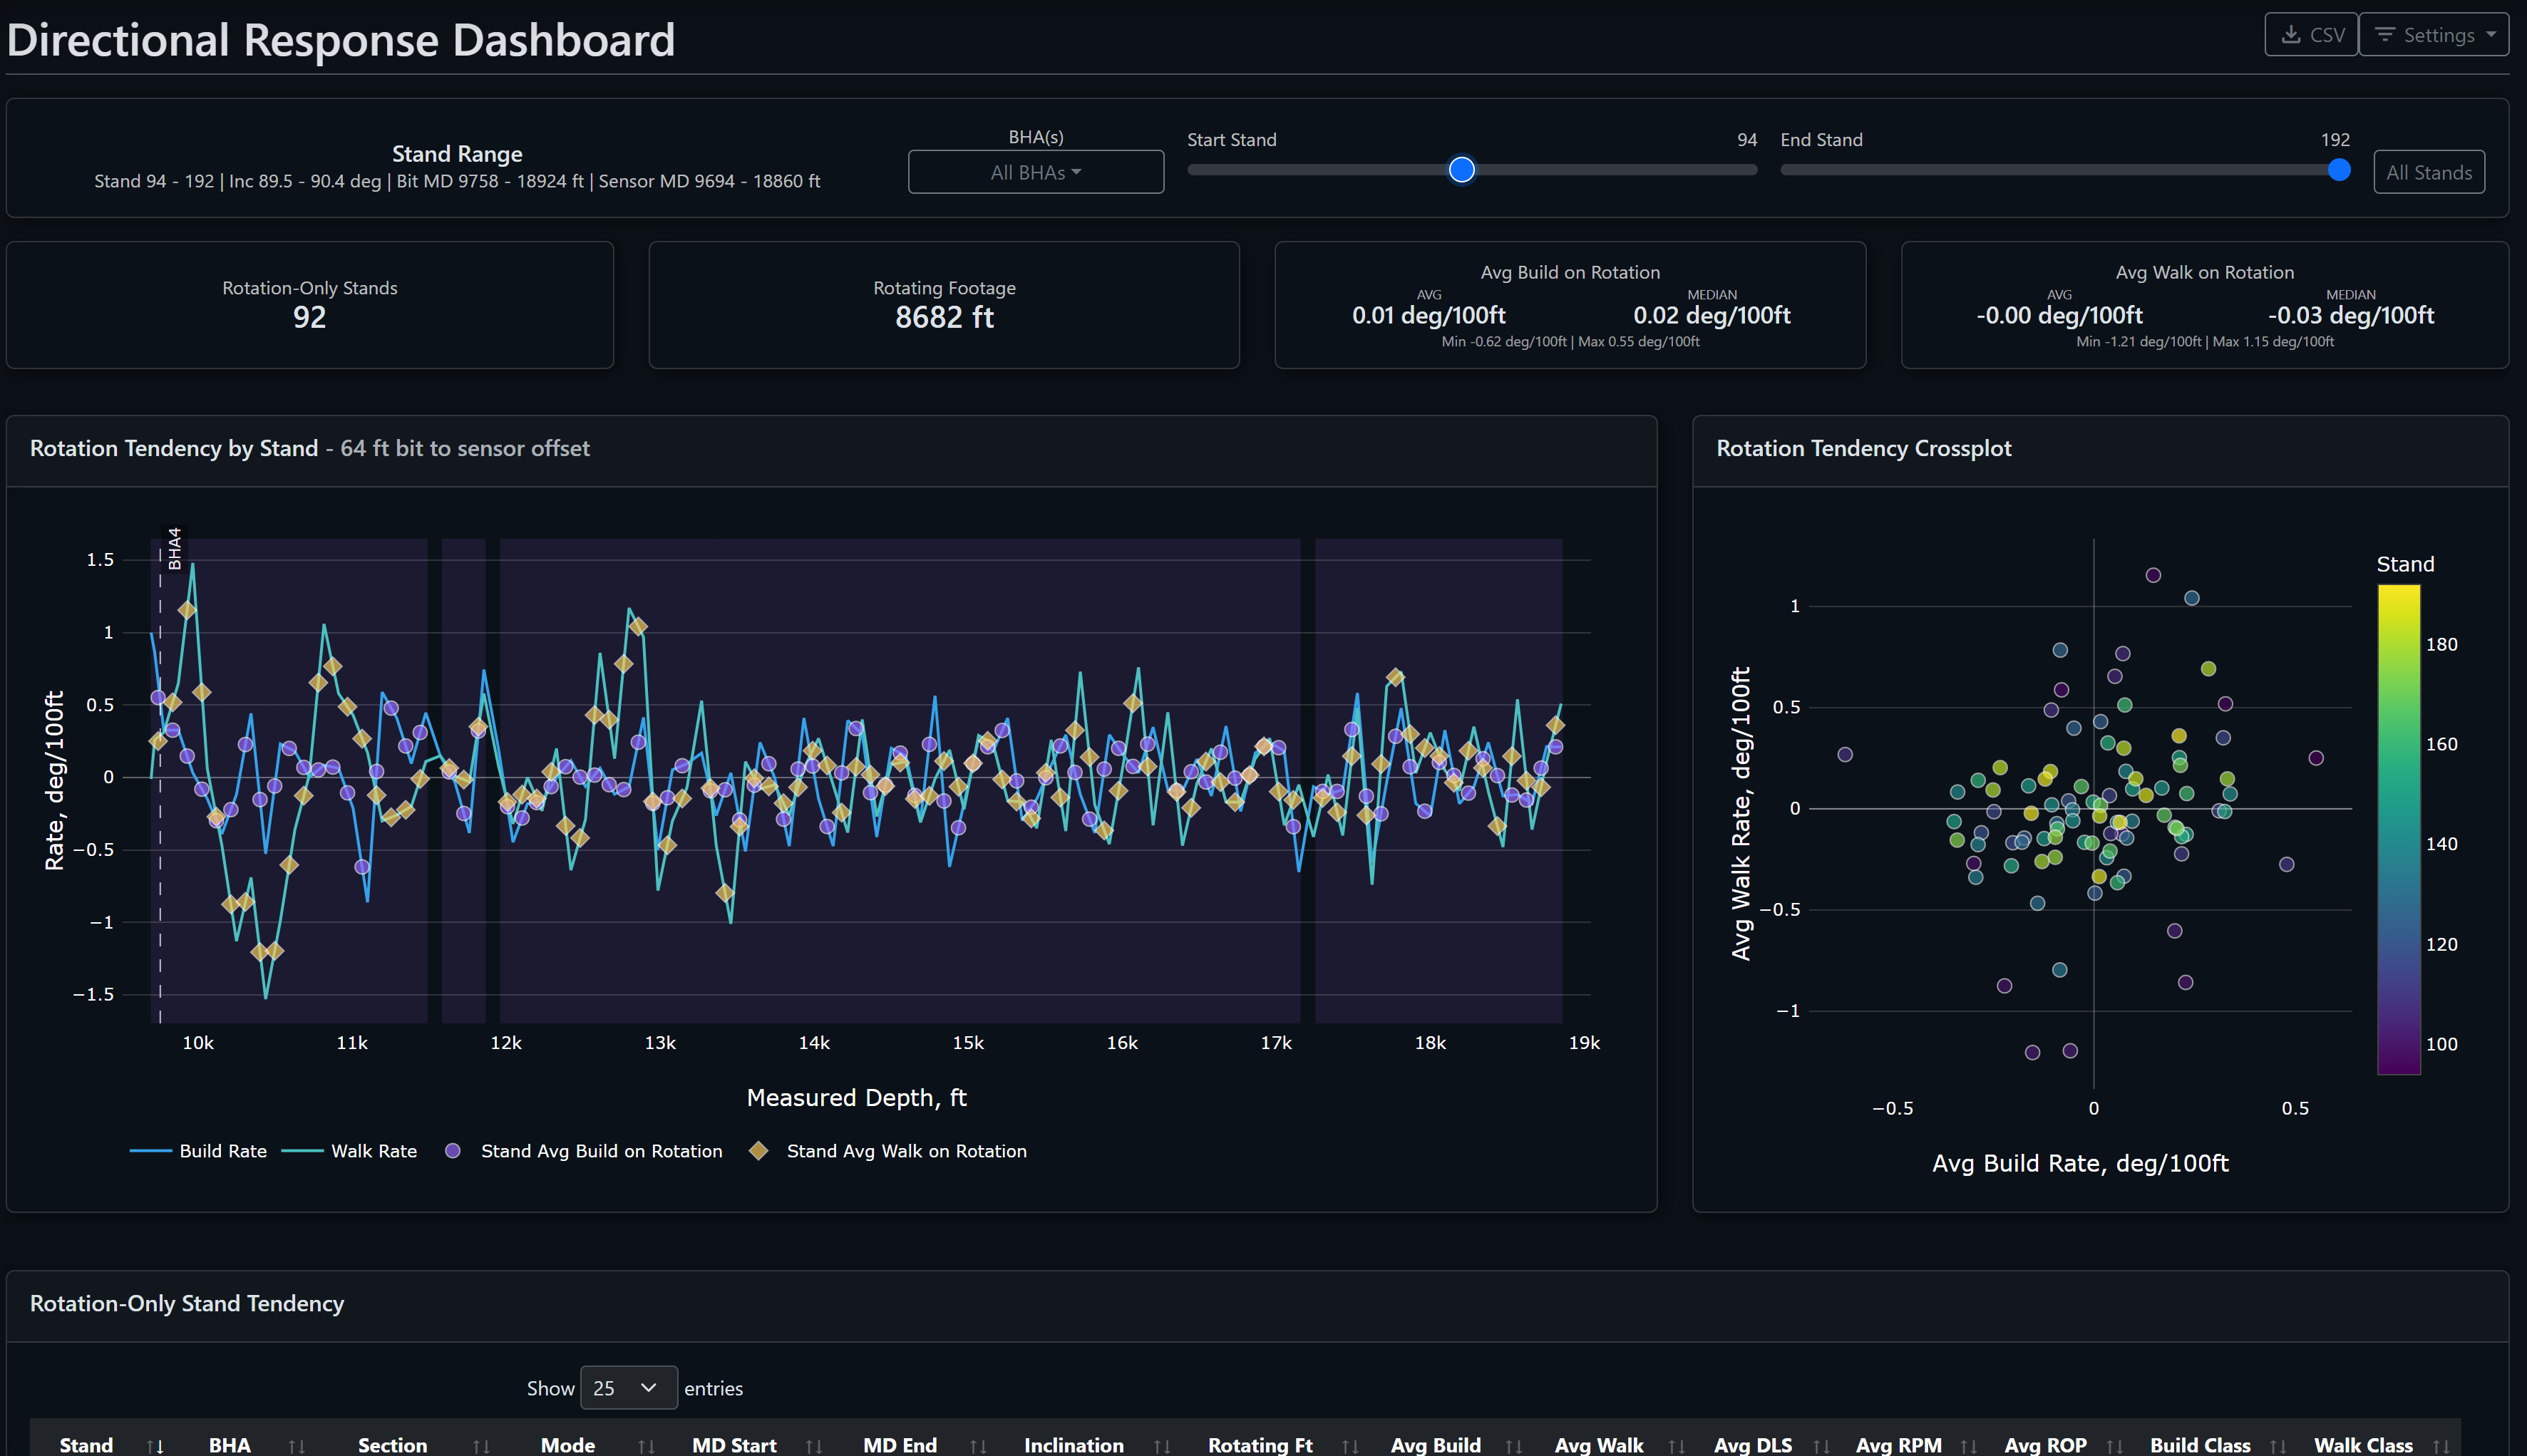
Directional response
Combine trajectory and tortuosity with rotation-only build and walk tendencies to identify repeatable assembly behavior without treating association as causation.
Field case study
Over three hours in the Midland Basin, actual pump pressure separated from the modeled response. The sustained residual and supporting signals helped field personnel distinguish a downhole washout from a surface pump problem.
The diagnosis remained tied to the measured pressure trend, model residual, and operating context.
Read the case studyAIDE + DM MCP Server
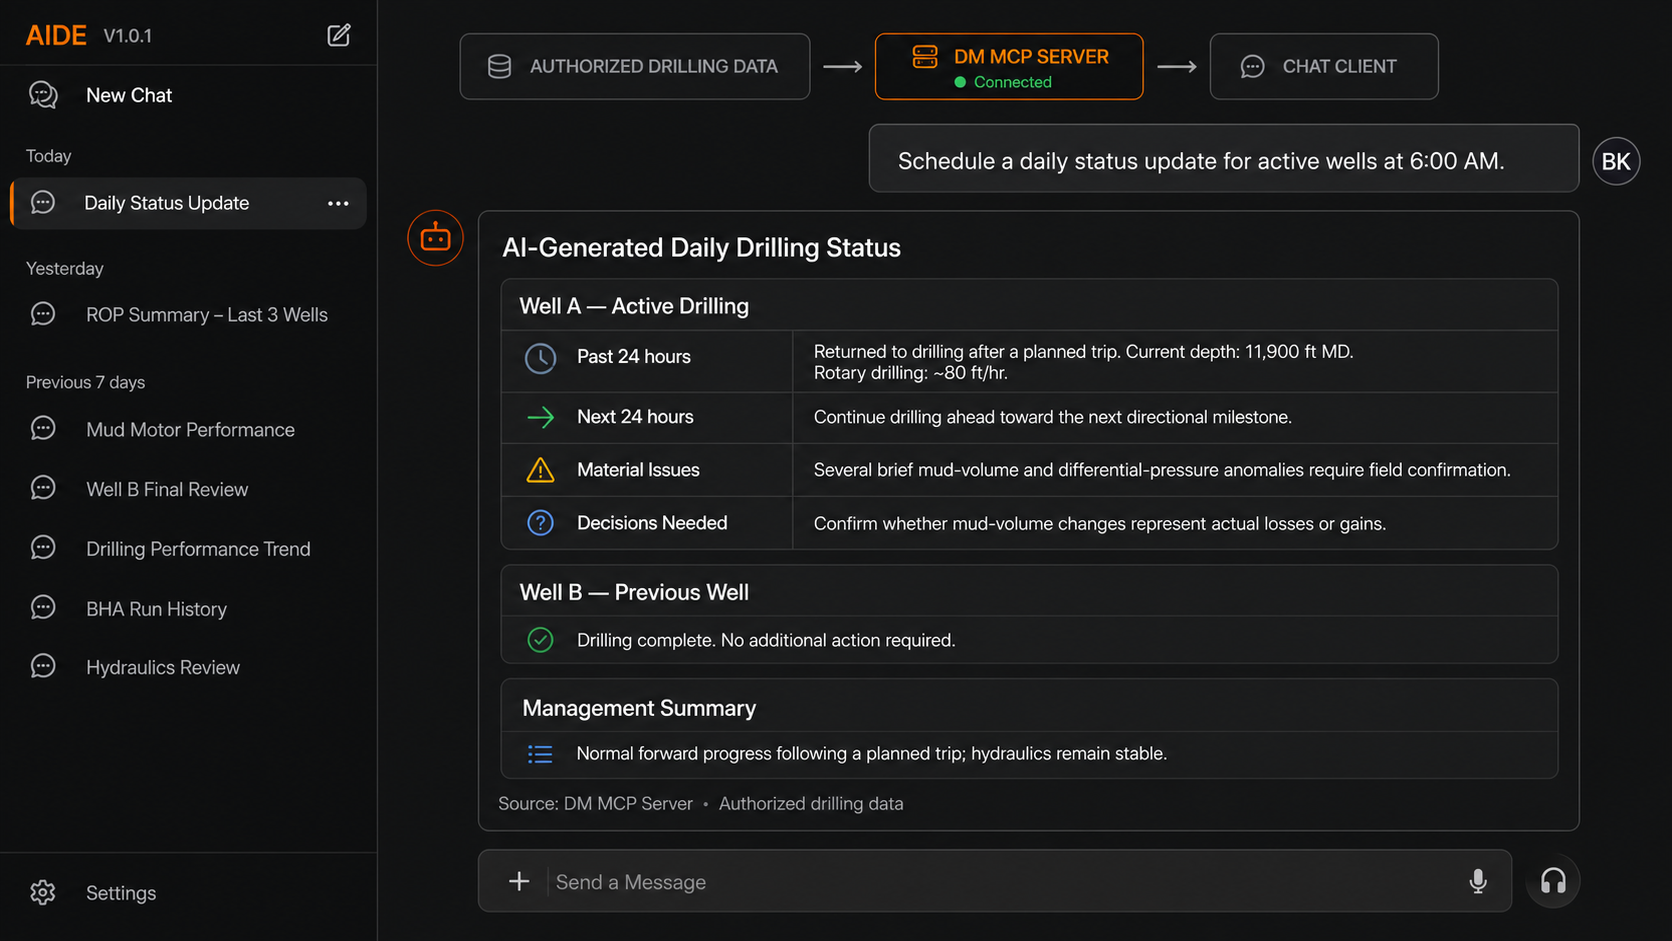
The DM MCP Server exposes authorized DrillingMetrics tools to MCP-compatible clients such as ChatGPT, Claude, or custom applications. Ask for current KPIs, historical comparisons, dashboard links, or a scheduled daily status update, then inspect the supporting evidence.

Mobile operations
Mobile views keep current status, selected trends, engineering models, and notifications accessible without reproducing the full desktop workspace.
See the active well, current operation, depth, and essential performance context.
Review selected time traces and engineering views from the field or away from the office.
Receive relevant updates and return to the operational evidence behind them.
Technical resources
Concise explanations of the drilling, data, statistical, and software choices behind each method.
From drilling teams
“We utilize the real time offset analysis tools on a daily basis (especially in the vertical intermediate section). We’ve found the real time road map is the best way to achieve reliable and repeatable results.”
“DrillingMetrics is a great tool to monitor down hole drilling dynamics in real time to troubleshoot dysfunctions and optimize parameters. It’s also very helpful comparing offset well performance to manage expectations and dial in drilling road maps thru challenging sections.”
“On our New Mexico well, DrillingMetrics gave us extensive data at the rig floor while drilling. Every curve dogleg stayed below the operator-defined limit, the RSS with mud motor BHA tripped through the curve on elevators, and we completed the 10,000-ft lateral in one run.”
Questions
No. The platform supports live operations and historical-well processing. Teams can establish an offset baseline before a live deployment or use historical analysis as a standalone project.
Typical inputs include WITSML streams, daily drilling reports, directional surveys, BHA records, mud reports, and existing historical databases. The exact integration depends on the source and authorization model.
No. AIDE retrieves and explains available drilling evidence. Engineering calculations remain deterministic where applicable, and operational decisions remain with the responsible team.
Yes. Operators and oilfield service companies have separate entry points, and historical batch-processing workflows can support service-company analysis and reporting.